

How many children with ASD are being completely missed by professionals?
November 30, 2016
Highlights
 While ASD may be partially missed in some children (that is, signs of ASD are noted but misinterpreted by professionals), it seems more likely that ASD is often completely missed (that is, signs of ASD are either not noticed or documented, or the child has never been assessed by professionals for a developmental concern)
Previously, we had established that:
- Missing a diagnosis of ASD has very real and important consequences for the child, and that developing programs to close gaps in identification takes a major commitment of time and resources.
- Methods used by the CDC to estimate prevalence indicate that both the CDC's reviewers and community-based diagnosticians may miss children with ASD in different ways, but appear to be strong enough to use as general guideposts to evaluate gaps in identification
In this chapter, I want to draw on the CDC's reports to elaborate on how professionals might miss children. And I want to take this a step further, to show how to estimate how many children might be missed in a given state, and how this might help draw a state-specific roadmap to improved identification.
I will use data reported by the South Carolina ADDM site to provide concrete examples of the how we might determine the number of 8 year-old children with ASD who might be missed. The examples I give are probably not unique to South Carolina; I expect that there are other states that in which we are missing just as many 8 year-old children with ASD. And there are also regions in every state in which we are probably missing just as many 8 year-old children with ASD. But these examples illustrate how we might begin to develop estimates that are specific enough to begin to drive changes in policy and practice... changes that are, in virtually every state, probably long overdue.
A partial miss
In the previous chapter, I used the CDC's study of the accuracy of their file review method to describe different ways that 8 year-old children with files at specialized health and education centers could be missed or misidentified by community-based professionals. Because these are children who have already received assessment or treatment of ASD or another condition, I consider them to have been only partially missed. The summary provided in the previous chapter can help us to estimate the number of partial misses in a given state. In a later chapter, I will describe the kinds of needs that might have been addressed through special education or treatment provided to these children, even thought their ASD was not diagnosed or was not currently driving their treatment plan.
A complete miss
Other 8 year-old children were missed by the ADDM reviewers for one of two reasons:
- They had no file on record to review because no concern about ASD or other conditions had resulted in any kind of developmental, special education, or psychiatric assessment or treatment.
- They had a file on record, but there were no red flags that would have caught the attention of ADDM reviewers. Based on the discussion of the validation study in the previous chapter, I might expect that 1 out of every 10 children identified with ASD by ADDM reviewers might fall into this group.
I would consider both groups of children to have been completely missed. In the rest of this chapter, I make the case for using the prevalence of ASD in states with higher prevalence to estimate the number of complete misses in other states. In a later chapter, I speculate about the characteristics of the group of children who are completely missed, the system of care that (and the professionals who) missed them, and what this might say about how we conceive of ASD as a disease.
How do we begin to estimate the number of 8 year-old children with ASD who are completely missed?
There are several different ways that we might estimate the number of 8 year-old children being completely missed, using the data from the ADDM network. Consider South Carolina, for example. We can infer that children with ASD have been completely Rates of ASD in SC compared to other statesmissed if the overall prevalence rate for South Carolina is much lower than the rate in another state in which similar data were gathered (i.e., in which both health and education records were examined).
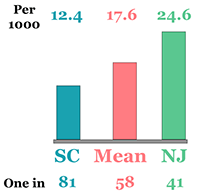
 One approach is to compare the prevalence rate for South Carolina to the state with the highest prevalence rate - New Jersey. The prevalence of ASD in South Carolina as determined by CDC's ADDM reviewers was 1 in 81 (or 12.4 8 year-old children with ASD for every 1 000 children), as indicated in the blue bar in the chart to the right. The prevalence rate in New Jersey was 1 in 41 children, or about twice that of South Carolina , as indicated in the green bar in the chart to the right. If New Jersey's prevalence were accurate, then one child is being completely missed in South Carolina for every child who was identified with ASD by CDC's ADDM reviewers.
A more conservative approach would be to compare the overall prevalence rate for a given state, like South Carolina, to the average of all other states in which similar data were gathered (i.e., in which both health and education records were examined. The rate in South Carolina rate is significantly lower than the average for other states in which both health and education records were examined (Arizona, Georgia, New Jersey, North Carolina, and Utah). The average in these other 5 states was 1 in 58, or 17.6 children with ASD for every 1 000 8 year-old children, as indicated in the pink bar in the chart above. Prevalence in South Carolina was therefore only 70% (or 12.4/17.6) of the number identified in other states. In other words, we are completely missing at least 3 children with ASD for every 7 children who might have been properly identified in South Carolina.
This more conservative approach might usually be favored. The validation study indicates, however, that the file review method did not dramatically over- or underestimate the number of children seen in specialized medical or education programs and who merited an ASD diagnosis by ADDM reviewers. Indeed, the file method might slightly under-estimate the prevalence of ASD. We therefore have no data to dispute the higher rates of ASD reported in New Jersey, and so I will use these rates as the denominator. Thus, for every 5 8 year-old children identified by the ADDM reviewers in South Carolina, another 5 may have been completely missed. While ADDM reviewers identified 302 8 year-old children with ASD via a records review, another 302 8 year-old children may have been completely missed.
How many of the children who were completely missed have a record in a specialized center?
A review of the validation study in the previous chapter suggests that, for every 9 children identified with ASD by ADDM reviewers, another child was completely missed because the clinicians and educators responsible for the original assessment and treatment did not detect or make note of any red flags that would have triggered a more thorough ADDM file review . These children were detected by the ADDM reviewers in the validation study only because all children in the validation study received a comprehensive assessment for ASD regardless of the presence or absence of red flags. Of the 302 who were completely missed in South Carolina, we can estimate that about 30 (or 10%) may have had records at a specialized health or education center.
How do we begin to estimate the number of children who might be partially missed?
There are several ways the data collected by the ADDM network helps to estimate who might be partially missed. Here is where the decision to use New Jersey's estimated prevalence rate begins to have even more important implications for planning and policy.
The most generous estimate: How many children have ever been diagnosed with ASD by anyone?
The most conservative way to estimate the number of partial hits is by comparing the number of 8 year-old children identified with ASD by the CDC's ADDM reviewers with the number of children ever diagnosed with ASD by any professional. This would include any previous OR current ASD diagnosis, anywhere in their health OR their special education records.
In South Carolina, a total of 302 cases of ASD were identified by ADDM reviewers. Of these 302 8 year-old children, about 85% (or about 256) had a diagnosis of ASD in their record. This includes some with a current ASD diagnosis, and some with a previous ASD diagnosis, anywhere in their health or education record. But that proportion changes when we consider the number of 8 year-old children with a diagnosis of ASD anywhere and at any time in their file, relative to all 604 8 year-old children with ASD in South Carolina. Only 42% of all 8 year-old children with ASD in South Carolina had a diagnosis of ASD anywhere in their medical or educational records.
Why could this be important?
An accurate diagnosis suggests that the system of care and services - and the professionals who drive it forward - has the potential for accurate and timely identification. There are, however, several important caveats.
- These data do not speak to the timeliness of identification. Among the five states which considered health AND education records, the percentage of children identified with ASD by ADDM reviewers who received comprehensive evaluations prior to 36 months of age ranged from 38% in South Carolina to 60% in North Carolina. Considered relative to the likely total population of 8 year olds with ASD in South Carolina, we would project that about 1 in 6 children, or 98 out of 604 eight year-olds, received a comprehensive evaluation prior to 36 months of age.
- Children might be missed by a health or education professional: Indeed, a substantial proportion identified with ASD by one group may not have been identified by the other. This may result from different assessments, interpretations, or presentations. This may also reflect the lack of communication and coordination across health and education centers.
- The ASD diagnosis is not necessarily considered current or primary: I discuss this in greater detail below, with respect to special education records.
- By no means does identification of ASD guarantee appropriate treatment or education: Accurate and timely identification is necessary but not sufficient for specialized early intervention. Indeed, the gaps in education and treatment are likely greater than those for identification... a topic far beyond the scope of this discussion!
A more conservative estimate: How many children are currently identified with ASD in the special education system?
Of these 302 children identified by ADDM reviewers with ASD in South Carolina, about 74% (or 223) had special education records. Of 223 children with special education records, about 61% (or about 136 children) were currently classified with ASD. Again, that proportion changes when we consider that number relative to all 604 8 year-old children with ASD in South Carolina. About 23% of the likely total population of 8 year olds with ASD in South Carolina were currently classified with ASD.
Some of the caveats offered previously remain applicable. Identification of ASD does not guarantee appropriate education. And this likely includes children who have not been identified with ASD by a medical provider, and so who may not benefit from related, specialized medical care.
Children whose ASD was not detected by ADDM reviewers are MISSED
Children who are partially missed had receive other specialized services and had signs of ASD in their record.
Children who are completely missed had no signs of ASD in their record OR had never been referred for specialized services.
For every 5 children identified with ASD in SC, 5 may have been completely missed

Children with ASD in SC
Identified by Completely missed
ADDM by ADDM
302 302
Children with ASD completely missed in SC
How many had records on file at a specialized center?
YES NO
30 (10%) 272 (90%)
What do ADDM data tell us about the likely outcomes for 100 8 year-olds with ASD in South Carolina?
50 were completely missed by community professionals
8 were partially missed by community professionals
42 were accurately identified at some point by community professionals
45 had never been developmentally assessed by a school or hospital
55 had been developmentally assessed by a school or hospital
Red flags of ASD were either not noted or noted documented in 5
8 had red flags that were missed
42 had an accurate ASD diagnosis on file
16 had a compre-hensive assessment by 3 years of age
23 were currently identified with ASD in school
Conclusion: These patterns can help to outline strategies to close gaps in identification
These analyses help us to imagine at least 5-6 scenarios in which ASD identification can be improved. Each scenario is associated with:
- Different strategies, risks, and outcomes,
- Different populations of children with ASD
- The involvement of different types of professionals and agencies.
I will elaborate on each of these factors in later chapters, but can offer some examples in the meantime.
- Some children with ASD are completely missed because they never received any medial or educational evaluation for a developmental or related concern. This might suggest strategies targeting front-line practitioners responsible for screening and referrals. In a later chapter, I will offer examples of such training, and speculate about the characteristics of these children that might cause concerns to be downplayed.
- Some children were seen by developmental specialists in schools or hospitals, who either failed to detect, to note, or to properly interpret indicators of ASD. This might suggest more targeted training in ASD.
Still other scenarios point to a different roadmap: for children identified late, for children identified by hospitals but not schools (or vice-versa), for children whose diagnosis does not drive their current treatment, and so on.
We must also anticipate that the balance of strategies may vary in each state. In the case of South Carolina, this analysis would suggest that ASD is more likely to be missed than to be detected, and that most of these cases were simply never referred for a developmental evaluation. An emphasis on the first scenario may be warranted. In contrast, strategies in New Jersey might focus on the second scenario. And these scenarios might even vary within regions of a given state.
These state-to-state variations may create other kinds of opportunities. On the one hand, a state-by-state analysis would be needed to individual the roadmap to that state's needs. On the other hand, there will be states that demonstrate similar patterns of need,. This can create natural laboratories for testing specific strategies. And different strategies could be systematically tested using a coordinated regional or national plan.
One very important note of caution... In a recent opinion piece, I described how researchers, leaders, and advocates invest too much hope in programs of training to address systematic breakdowns. In a later chapter, I will argue that we cannot simply reduce the problem to a failure of detection by a given professional. I will describe the many barriers faced by professionals responsible for detecting children at risk for developmental concerns and for conducing comprehensive evaluations, and related breakdowns in the system of care that create dis-incentives for timely identification.
The logo is adapted from Joaquim Alves Gaspar's drawing of Pedro Reinel's compass rose.
Connect