

How do you estimate the prevalence of ASD?
September 23, 2016
Highlights
It is simply too expensive for researchers to conduct comprehensive assessments of every child in the country to determine how many of them have ASD. Instead, researchers adopt several strategies to estimate prevalence that can much more cost-effective and almost as accurate. We can group some of estimation strategies used in determining ASD's prevalence into two types. These strategies are also summarized in the sidebar below, "How does a child end up being in a Prevalence Study?" These methods suggest that there are at several ways we can "miss" or fail to identify ASD, and that each way has specific consequences for the children who are missed, and the support needed to help the agencies and professionals who missed them.
Strategies for estimating prevalence
Choosing a sample of children
Some strategies center on the definition of the sample: that is, the sub-group we will assess in the total population of children for which we want to estimate prevalence.
Assess prevalence in a sub-set of states representative of the country
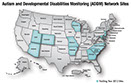
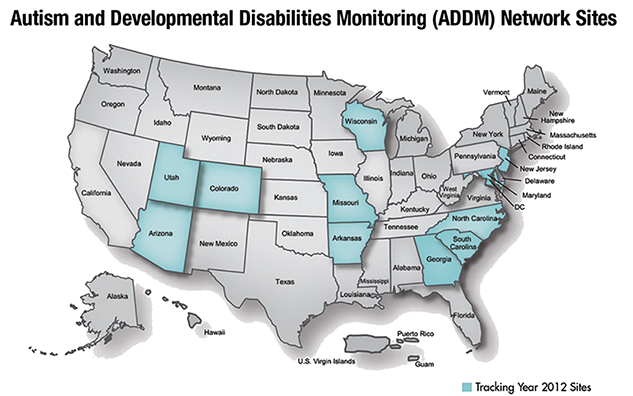
Instead of assessing a sample in each of the 50 states, the CDC created the Autism and Developmental Disorders Monitoring (ADDM) Network through a competitive grant process. The CDC's ADDM Network is comprised of University-based autism research centers in 11 states across the country.
Assess ASD in 8 year-old children
This age was selected because it was viewed as likely to capture as many children as possible, given when ASD typically emerges. But this may miss children in whom ASD emerges more clearly after 8 years of age.
The decision at assess 8 year olds also introduces a lag between when children are diagnosed, when these data are gathered, and when they are actually reported. The CDC's most recent report gathered data from 2012 records, for children born in 2004. On average, those with a diagnosis of ASD on file were evaluated in 2008. In other words, these data reflect diagnostic practices from 8 years earlier. Assuming that any new program for improved diagnosis takes at least 2 years to design and launch, it takes at least 10 years to respond to reported rates of prevalence. Any long-term plan will have to identify other mechanisms for tracking progress towards meeting the needs of children with ASD without introducing an 8 to 10 year lag.
Assess children who have already received assessment or treatment services
This allows reviewers to determine a likely diagnosis of ASD based on a detailed review of existing records (described below) gathered from agencies that treat children, instead of systematically screening for ASD in all children from these regions. This strategy was determined to most efficiently capture children already diagnosed with ASD, or who are displaying signs of ASD but who have not yet been diagnosed. But this strategy seems likely to miss some children:
- Those whose ASD is not significant enough to warrant referral to specialists
- Those from rural regions where specialists are difficult to access
- Those from other traditionally underserved groups, like racial or ethnic minorities, those in poverty, or those for whom English is a second language. As discussed later in this series, CDC's ADDM data indicates that White children are identified much more often than Hispanic or Black children. And other studies consistently indicate that rates of identification are lower among children living in poverty.
Consider children served in both health and education centers whenver possible
This strategy casts the widest possibly net, and recognizes that ASD can be identified by different kinds of specialists in different kinds of agencies. For a variety of reasons, not all ADDM sites were able to access records in both health and education agencies. ADDM sites that accessed health and education records consistently reported significantly higher prevalence that those able to only access health records.
Who may be missed by this sampling strategy?
Given the budget constraints, these appear to be sound choices for creating a sample of children on which an estimate of prevalence is to be based. When interpreting these estimates, we must bear in mind, however, that this approach will never capture those whose ASD was not significant enough to require any specialized and related health or education services. This approach may also miss some of those who have difficulty accessing any specialized health or education services, like people from racial or ethnic minorities, or people living in poverty or in rural regions.
Assessing the presence of ASD: The File Review method
Other estimation strategies center on the type of assessment that is conducted instead of a comprehensive diagnostic assessment. The primary assessment strategy used here also has implications for how we interpret and act upon the CDC's prevalence estimates.
One set of ADDM reviewers begins by scanning all records for 8 year old children served in participating agencies. Reviewers looked for a diagnosis of ASD in the file, or for possible red flags or potential indicators of ASD. Records with enough red flags were then subjected to a more thorough review by a second set of specially trained ADDM clinician-reviewers. These reviewers assigned a label of ASD if they found enough ASD red flags. As we will discover later, many children already had a diagnosis of ASD on file
Conclusion: These methods seem likely to yield estimates that are strong enough to begin acting upon
Many questions have been asked about whether these methods will yield reliable results. It is important to distinguish between methods used to draw conclusions about individual diagnoses, and those intended to yield estimates in a population of children. I would never advocate that a formal diagnosis for an individual child be based on the methods described above. But I believe that the ADDM approach is a reasonable compromise if it proves to neither over- or under-diagnose ASD across a sample of children, when compared to the results obtained using a full clinical assessment (as discussed in the next piece in this series).
Prevalence research is traditionally expected to generate valid estimates capable of standing the test of time. In a recent debate, critics asserted that we cannot establish the "true" prevalence of ASD until we minimize the kind of "errors" community-based professionals might make. The solutions they have proposed thus far have involved conducting more research. These concerns are valid if our primary goal is to generate the most precise estimates possible. But how precise do our estimates need to be before we can take action? Can we justify the cost of this approach and the additional delays it would introduce in generating conclusions and implementing a plan?
These studies may serve a second - and perhaps more important - purpose: to generate hypotheses about state and national trends in identification among community-based professionals. For example, advocates and program leaders often want to know whether these research-based estimates of prevalence appear close to the actual proportion of children receiving health and education services related to their ASD. And if these proportions differ, is it because we missed ASD in a child's ASD or we misdiagnosed ASD (e.g., labeled a child with ASD when another label would be more appropriate). Do these different outcome require different solutions?
Differences between a label based on a file review and a label based on a full clinical assessment by a specialized team raise other interesting questions. Where do community-based professionals and researchers disagree? Are community-based professionals completely missing the signs of ASD or misinterpreting the signs that they do see? Or are community-based clinicians identifying different priorities based on the kinds of services that are available, and how these children are likely to respond to these services?
A program to systematically that tests hypotheses about community-based identification and treatment of ASD could explain these results and suggest different strategies to close these gaps. Each of the remaining pieces in this series examines how prevalence research might serve this second purpose.
Related Content
ADDM: 2016 CDC Report
CDC's ADDM Network

How does a child end up being in a Prevalence Study?
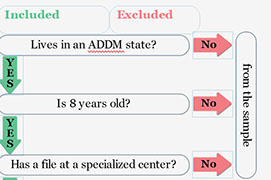
Included
Lives in an ADDM state?
Is 8 years old?
Has a file at a specialized center?
File has red flags when screened?
Clinical review finds many flags?
Child has ASD
from the sample
from the File review
Excluded
The logo is adapted from Joaquim Alves Gaspar's drawing of Pedro Reinel's compass rose.
Connect